Microsoft AI Science Engine
The AI-powered research platform had poor usability and communication issues in its UI.
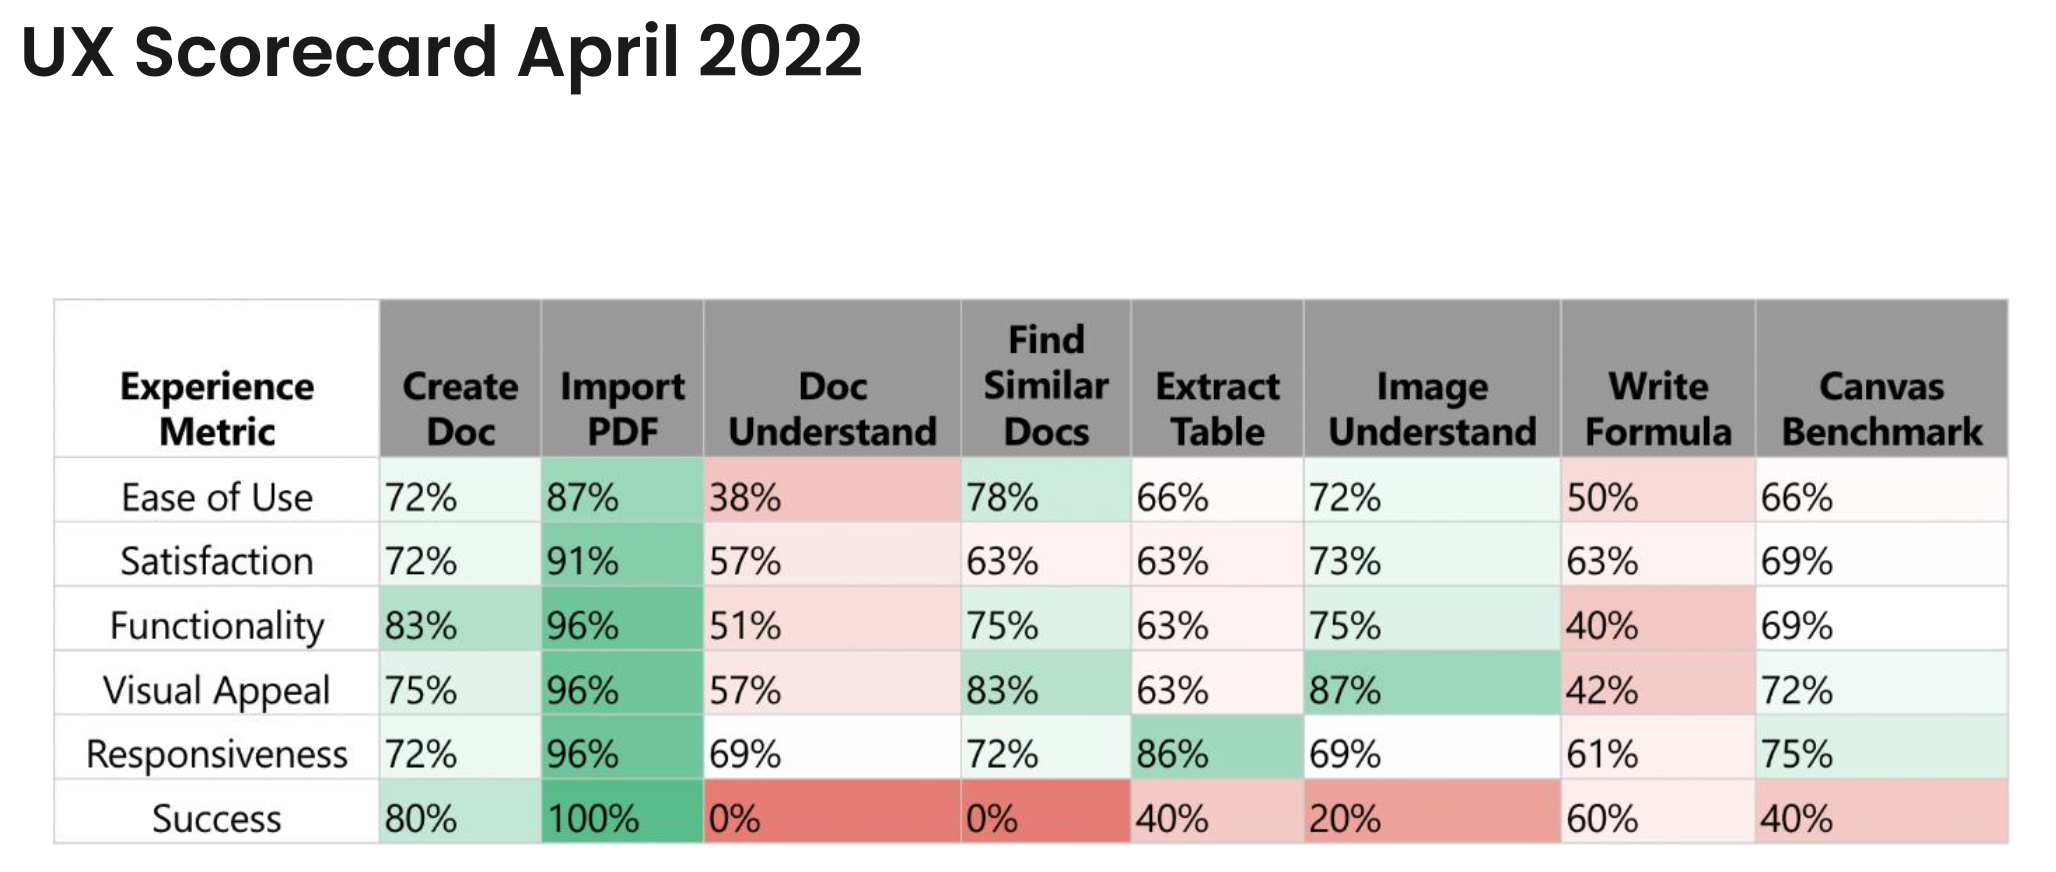
Usability Audit 2022 - Failed
Key Problems
Overly technical language made interactions unclear.
A lack of feedback and intuitive results was displayed, making it difficult for scientists to interpret the data.
Impact:
Scientists struggled to effectively use AI-driven insights.
The platform failed usability audits, which negatively impacted adoption.
Process & Solution
Redesigning AI Interactions
Improved UI for key interactions:
Search experience: Simplified querying and input prompts.
AI feedback visibility: Made system responses more apparent and actionable.
Query time transparency: Provided users with better progress updates.

Design System & Usability Enhancements
Refined the Design System for consistency across features.
Improved accessibility following Azure Design Systems.
Worked closely with developers to ensure pixel-perfect execution.
Error Messaging & Empty States
Conducted an audit of error messages to improve clarity.
Collaborated with copywriters & illustrators to create empty states.
Ensured error handling aligned with user expectations & best practices.

Collaboration & Workflow Optimization
Worked cross-functionally with Scientists, PMs, Developers, and Researchers.
Led handoff improvements between designers & engineers to streamline implementation.
Mentored designers & supported onboarding efforts.


Impact & Results
✅ Audit Success
Before: 80% of user journeys failed usability tests.
After: 99% of user journeys passed in the final audit.
Improved Adoption & Efficiency
Modernized the UI to align with Microsoft’s standards.
Enhanced feedback mechanisms improve user trust in AI outputs.
Strengthened internal communication between designers, scientists, and engineers.
Lessons Learned
Handling AI-driven design is complex—balancing transparency and usability is key.
Accessibility-first design ensures better adoption across all users.
Collaboration across disciplines (AI, science, UX) is crucial for success.
More About This Project
To learn more about this work, check out the blog posts below.
Novartis
Democratizing access to AI
UBC
AI Innovation Partnership with UCB
Novo Nordisk
Novo Nordisk and Microsoft collaborate to accelerate drug discovery and development using big data and artificial intelligence
Microsoft
Novartis empowers scientists with AI to speed the discovery and development of breakthrough medicines
UCB
UCB and Microsoft Expand Collaboration to Accelerate Drug Discovery and Development